The Kinetic Sequence
I began doing golf biomechanics research in 1999 when I signed up for an independent study project as part of an undergraduate degree in Kinesiology. For this project I attempted to quantify the 3D kinematics of the lumbar spine during the golf swing using an electromagnetic motion capture system. I’ve been working on measuring the biomechanics of human beings ever since then and all my research has led me to one indisputable conclusion: Human Beings are Messy!
The variability we find in the biomechanics of different golfers of all skill levels continues to amaze me. Whether you’re looking at a population of brand-new golfers who have just taken up the game, or you’re looking at PGA professionals playing the game at the highest level, you’ll find one thing to be true, everybody does it slightly differently. This really became apparent to me when I started to work for Swing Catalyst and do education for them.
Many teaching professionals would ask me questions like: what should the center of pressure (CoP) trace/curve look like? Should we try to get all the ground reaction force (GRF) curves into the tour average? I didn’t have a good answer to these questions, so I started analyzing what the best in the world did through the large set of PGA tour data that Swing Catalyst had collected. Doing this research, I realized that everyone was different, and they all had unique aspects to their CoP and GRF data that made the swing work for them.
After meeting Mike Adams at the 2015 Midwest PGA meeting, I started to understand why certain factors worked for some players and not for others. Though solving this problem of the complexity of human movement while swinging a golf club is not an easy one, we are continuing this journey to this day by performing research to better understand how to optimize GRF and CoP patterns for every golfer.
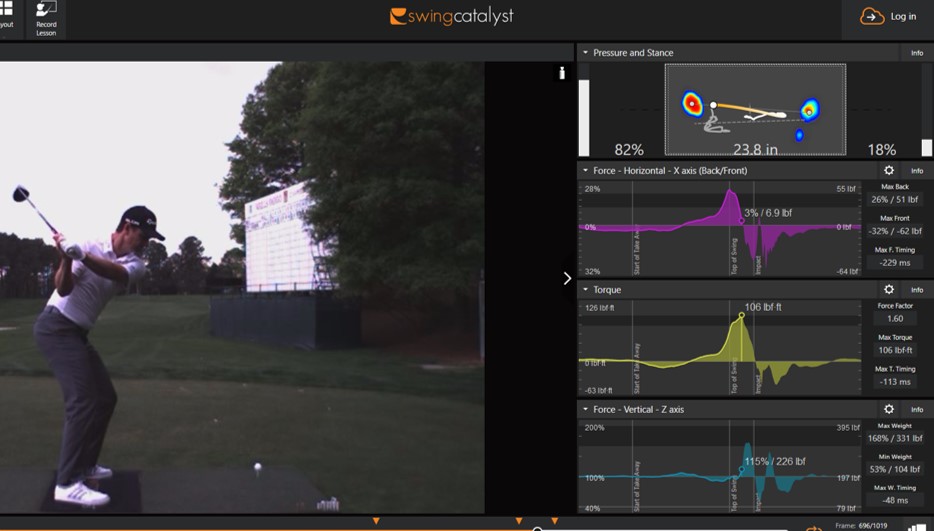
Early on in my time working for Swing Catalyst, we made another discovery that has really helped improve our understanding of the golfers’ connection to the ground. I was working on Chris Como’s Swing Catalyst plate in Dallas with Chris, Sean Webb, Mike Granato, and several other great instructors when we discovered something that would later be called the “Kinetic Sequence”. What we discovered was that the order in which the ground reaction forces measured by the Swing Catalyst plate peaked in the downswing was remarkably consistent, no matter what player we looked at. This order was: horizontal (back/front) force always peaked first, torque always peaked second, and the vertical force always peaked third. This sequence is shown below in one of Justin Rose’s driver swings:

Where we are in Justin’s swing here is at about left arm parallel in the downswing. This is where his torque (yellow) graph is reaching its maximum value. If you look above the torque graph, you will see the Horizontal (back/front) graph in purple. At this point in the swing, this Horizontal graph has already reached its peak and is on the way down. This Horizontal graph generally peaks somewhere around the top of the backswing. And if you look below the torque graph, you see the Vertical force in blue. This graph is still on the way up to its peak, which generally happens sometime around club parallel in the downswing. So it has not peaked yet and it is the last of the three forces to peak in the Kinetic Sequence.
These three forces have been given several names over the last several years, but one thing remains the same. The Kinetic Sequence is the closest thing to a universal truth that I have found in the biomechanics of golfers. The order in which these forces peak is true in an extremely large percentage of the golfers we have tested (with only a few rare exceptions). This order is:
- 1. Horizontal/Linear/Glide Force
- 2. Torque/Rotational/Spin Force
- 3. Vertical/Launch Force

